PRIMATES IN ANIMAL STUDIES
primates in animal studies
an overview of nonhuman primates living in research facilities in the united states

Nonhuman Primates in US Research Facilities by State
In the accompanying chart, we parsed the data from the reports. All states, plus the District of Columbia and Puerto Rica, are represented. We ordered the chart based on the number of nonhuman primates living in research facilities in each state or commonwealth, from the highest population to the lowest.
The row highlighted in red indicates the states with the 10 greatest number of nonhuman primates residing in their research facilities.
Massachusetts, the state in which we are headquartered, has the ignoble distinction of housing the greatest population of nonhuman primates in the United States with 18,933 monkeys in our research facilities. That number increased by 1,728 monkeys over 2018.
This represents the second year in a row in which Massachusetts has housed the largest nonhuman primate research population in the United States. #2 is Louisiana with 13,752 and #3 is Maryland with 12,810.

Each USDA-registered research facility is required by the Animal Welfare Act to submit an Annual Report that documents its use of animals for research, testing, teaching and/or experimentation. The numbers reported may not be all inclusive as some research facilities might not have reported in time for publication. The USDA APHIS reports can be found here. Scroll down to Animal Usage by Research Facilities, by Year.
USDA Animal Care compiles these numbers in 5 reports. Each report is based on a specific pain category. The report categories are:
- Column B = Animals research facilities held but did not use for regulated activities
- Column C = Animals research facilities used in activities that did not involve pain and did not administer pain relieving drugs
- Column D = Animals research facilities used in activities involving pain and administered pain relieving or similar drug
- Column E = Animals research facilities used in activities involving pain or distress and for which administering pain relieving drugs would adversely affect results
- Column F = Total number of animals research facilities used in regulated activities; Column C + Column D + Column E
Note: the Column F report does not include Column B, animals that are held in research facilities but were not actively involved in studies during the reporting period. To determine the actual total number of animals residing in research facilities during that year, the totals in Column B must be combined with those in Column F.
Now, for the complete picture...
Animals in research in the us 2019
The Animal Welfare Act reports only protects warm-blooded species. Not included are birds, rats, and mice that are bred for research, despite the fact that they represent 90-95% of the animals used in research.
The Animal Usage Reports, also excludes cold-blooded animals, such as fish, reptiles, and amphibians. Thus an additional unknown unreported number of animals actually make up the full account of animals used or held in research facilities.
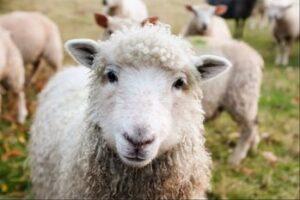
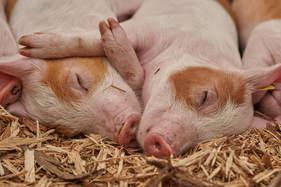
In addition, the Animal Welfare Act, and therefore the Annual Usage Report, excludes “farmed animals” raised for food or fiber or used in agricultural research, such as cows, goats, and pigs. So the pigs, sheep, and other farm animals quoted in the USDA annual reports are used for some other research purposes, whether surgical studies, biomedical studies, or something else.
Thus, the 934,771 animals in US research facilities in 2019 probably represents about 10% (or less) of the actual numbers of animals in research facilities for that year.


Note: In addition to the species listed above, an additional 208,116 animals are listed as “all other covered species.” We don’t know what that means or who they are. What we do know is that the actual number of animal living in US research facilities is likely in the many millions.